Understanding consumer readiness for circular practices provides valuable insights for designing and positioning sustainable offerings.
Survey insights
The CircEUlar consumer survey examines motivations and decision-making across mobility, manufacturing, and building sectors, focusing on sharing, repair, second-hand use, and space optimization. These insights help businesses align their circular strategies with actual consumer needs and better understand what drives engagement in circular behaviour.
The employee survey reveals that mobility and building sector employees often overestimate consumer willingness to adopt circular behaviours like car sharing, downsizing, or shared living. The more sustainability was part of their job, the higher the over-estimation. Employees can leverage their sustainability expertise to improve consumer engagement, supported by ongoing consumer insight checks.
Finally, employee initiative in driving circularity is closely tied to sustainability expertise, organizational culture, and support for reducing, reusing, and recycling. A workplace that values and enables circular behaviours can empower employees across all roles to advance a more circular economy.
Mobility sector: Insights about car-sharing
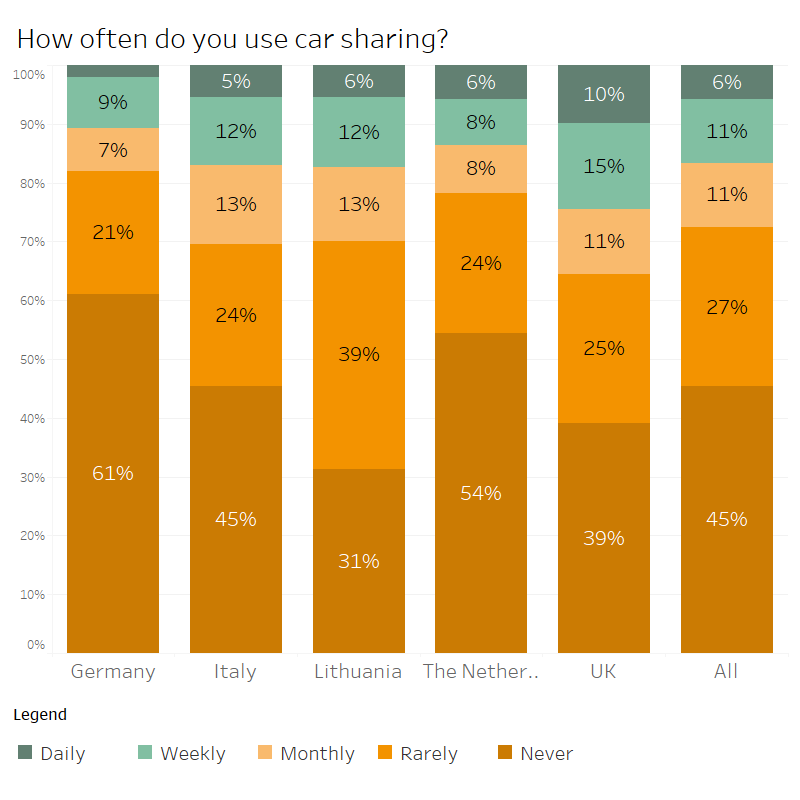
Use of car sharing among consumers reporting having access to car sharing options
45% of survey respondents have access to a car-sharing option in their neighbourhood. Out of these 2,558 people who indicated that car-sharing services were available in their area, most don't use them regularly. Nearly three-quarters (73%) either rarely use car sharing (27%) or never use it (45%). Only 22% use car-sharing services on a weekly or monthly basis. Germans use car-sharing services the least, with over 80% rarely or never using available services.
Car sharing appears to be most commonly used in large cities and among individuals under the age of 45. On average, families with children show a higher level of usage; however, it is important to note that they represent a smaller share of the sample (36%) of respondents who report having access to car-sharing services.
Among car owners, the most frequent car-sharing users are those who use their personal vehicles either occasionally or very frequently. A similar pattern is observed among bicycle owners and users. This suggests that car sharing particularly appeals to occasional and daily travellers. Finally, individuals who rate the public transportation system as either “very good” or “very poor” exhibit the highest levels of car-sharing usage.

Likelihood of car sharing use among consumers without current access
Of those participants who indicated that car sharing was unavailable in their area, many are also unlikely to use it if it becomes available. Especially consumers in the UK, Germany, and the Netherlands are unlikely to use car sharing if it were available (35-48%). Italian and Lithuanian consumers showed higher interest, but over half (65-68%) were neutral or unlikely to use car sharing if it became available.
Employees significantly overestimate the proportion of consumers who would use car sharing if it were available. This overestimation increases progressively among employees whose roles are more closely related to sustainability topics. In contrast, the effect is less pronounced in the Operations, Sales, and “Other” departments (the latter includes many respondents from Production, Technical, and Engineering roles).
Manufacturing sector: Insights about repair services and second-hand purchases
Repair services
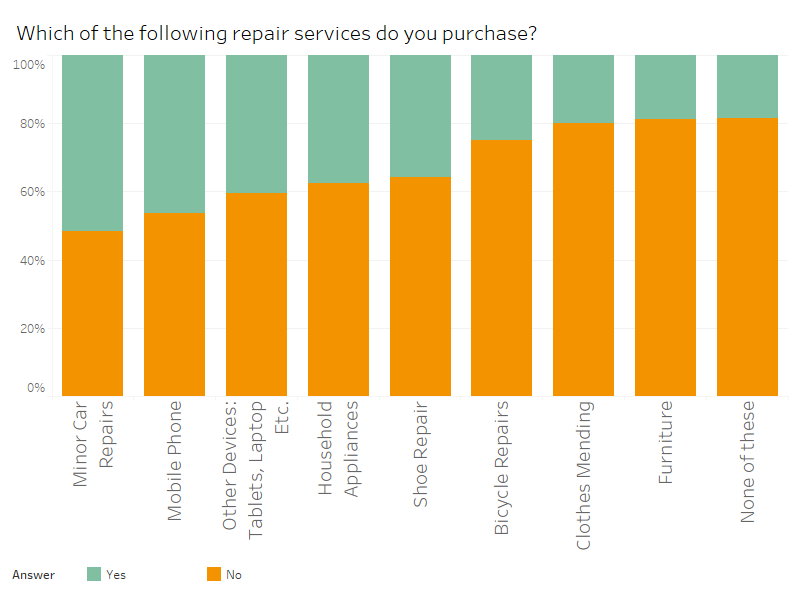
Most survey respondents (82%) purchased at least one repair service, ranging from 90% in the Netherlands to 72% in the UK. Minor car repairs are most popular (51%), with Dutch consumers leading most categories except household appliance repairs, where Italians lead (43%). Furniture are the categories with the least repair services purchased.
Second-hand purchases
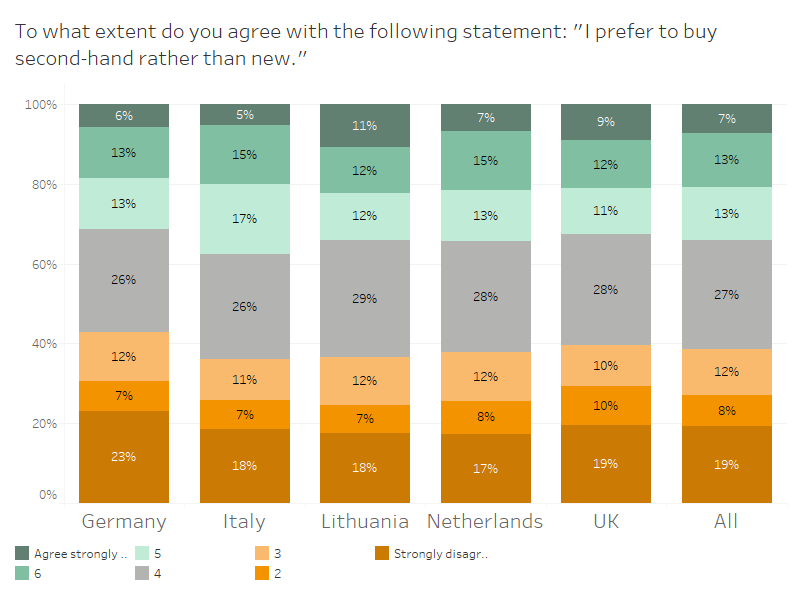
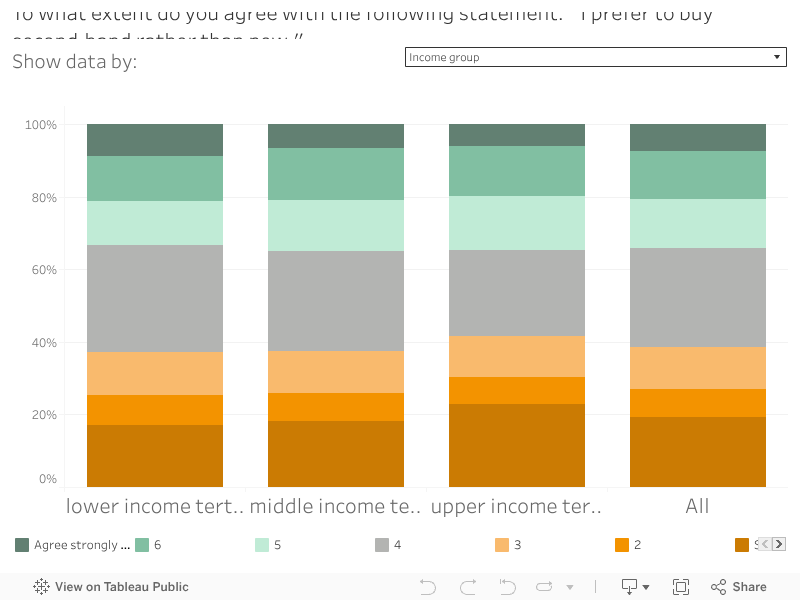
About 27% of all respondents prefer second-hand purchases, while 19% strongly disagree with this preference.
Differences between countries in second-hand purchasing preferences are relatively small, with Lithuania showing the highest preference overall. On average, women express a stronger preference for buying second-hand than men. This preference is more pronounced among younger age groups and is slightly higher within lower income brackets.
Moreover, consumers who frequently use online platforms to buy second-hand goods show a particularly strong preference for second-hand purchasing. Therefore, the most distinct profile emerging is that of young, digitally connected women with modest incomes, who are regular users of online second-hand platforms.
Building sector: sharing space and downsizing
Sharing spaces
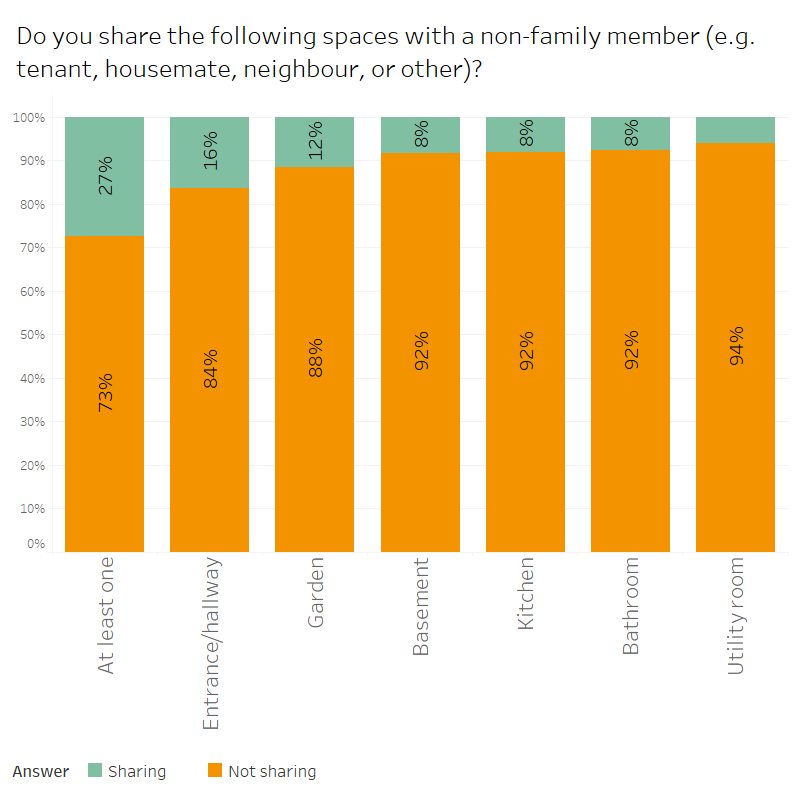
Survey respondents have been asked whether they currently share spaces with a non-family member (e.g., tenant, housemate, neighbour, other). Consumers’ current sharing of their living spaces varies by the privacy level of the different areas: 16% share entrances, 12% share gardens, and only 8% share kitchens or bathrooms. Overall few consumers share their living spaces with non-family members (73% non of the mentioned spaces).
The willingness to permanently share spaces with non-family members (such as tenants, housemates, neighbours, or others) is generally low. Spaces associated with lower levels of privacy—such as entrances, hallways, and gardens—are the most likely to be shared. Willingness to share is significantly higher among respondents who are already sharing their space, suggesting that prior experience may influence preferences.
Downsizing
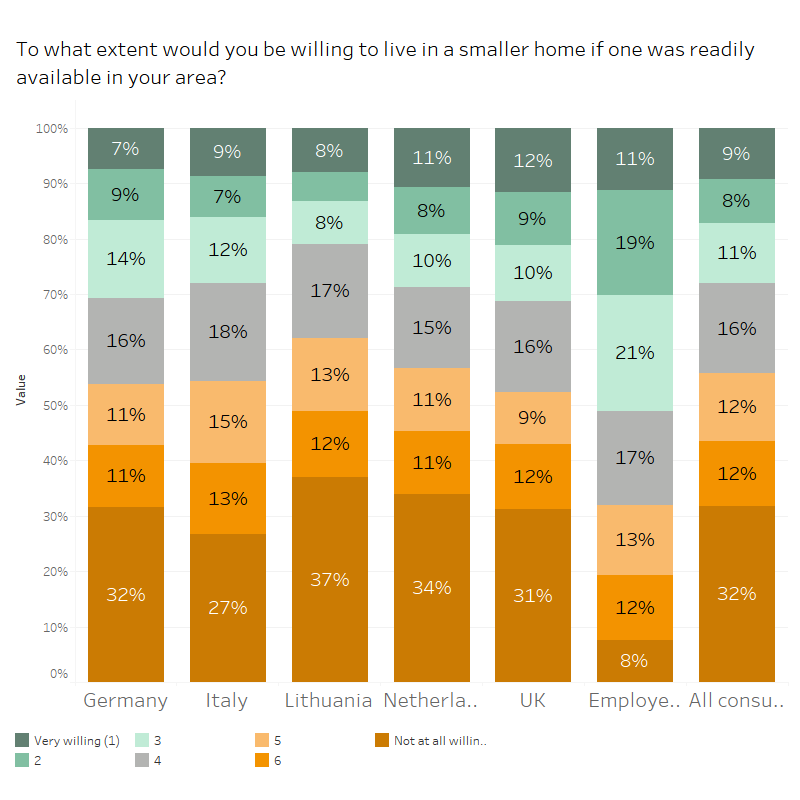
Only 28% of respondents are willing to downsize their homes, while 56% are unwilling or very unwilling. Nearly one-third (32%) are completely unwilling to move to a smaller home even if readily available.
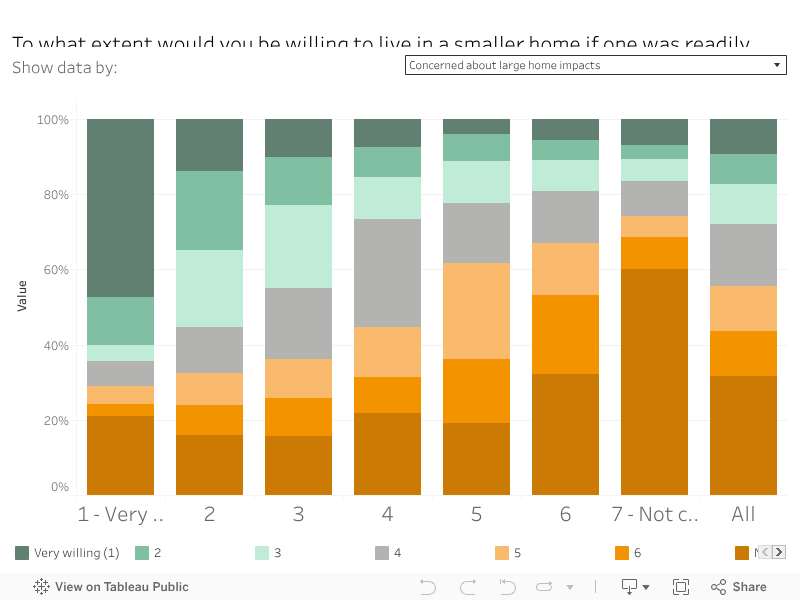
The survey results show that this willingness is strongly linked to concerns about the environmental and social impacts of living in a large home. It is also more pronounced among tenants paying market rents or living rent-free. Indeed, homeowners may face higher transaction costs in relocating, and tenants benefiting from below-market rents may have fewer incentives to relocate.
Findings show that employees markedly overestimate consumer willingness to downsize: they estimate 51% of consumers to be willing (4–7), whereas the consumer survey reports only 28% (4–7 on the Likert scale).
Are employees driving circularity from within?
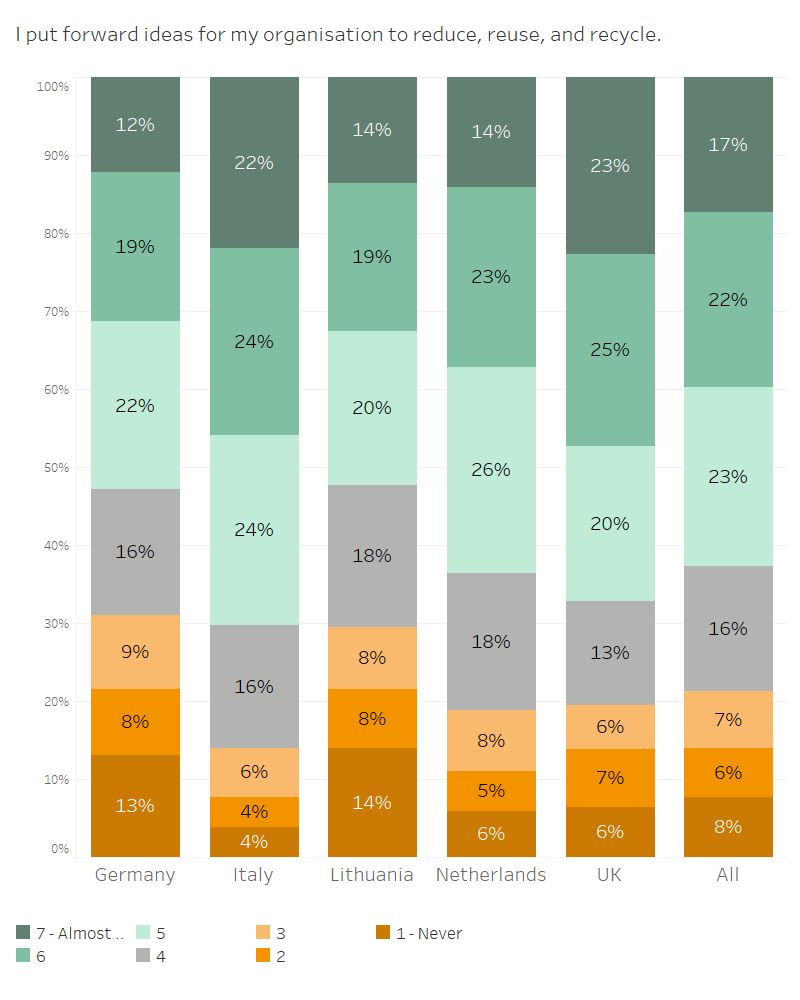
Understanding what drives circular economy success requires looking beyond strategies and processes and focus on the people who implement them. Employee behaviours can power internal transformation towards more circularity. Respondents (N=3,391) were asked if they put forward ideas for their organisation to reduce, reuse, and recycle, and had to reply from 1-never to 7-almost always. This analysis allows us to examine whether employees can act as drivers of circularity within a company.
At the country level, Italian employees show the highest levels of initiative. By sector, the consulting and scientific sector stands out across the three reference industries (mobility, building, and manufacturing). Finally, these initiatives are more prevalent among senior and upper management. However, the survey clearly indicates that the strongest correlation is with sustainability expertise, measured by the question: “To what extent is sustainability part of your formal job description?”. And this expertise is more widespread in the research and consulting sectors, as well as among upper and middle management. It is reasonable to expect that employees with sustainability-related responsibilities are more likely to take initiative, since it is part of their role and they are likely to be “rewarded” for doing so.
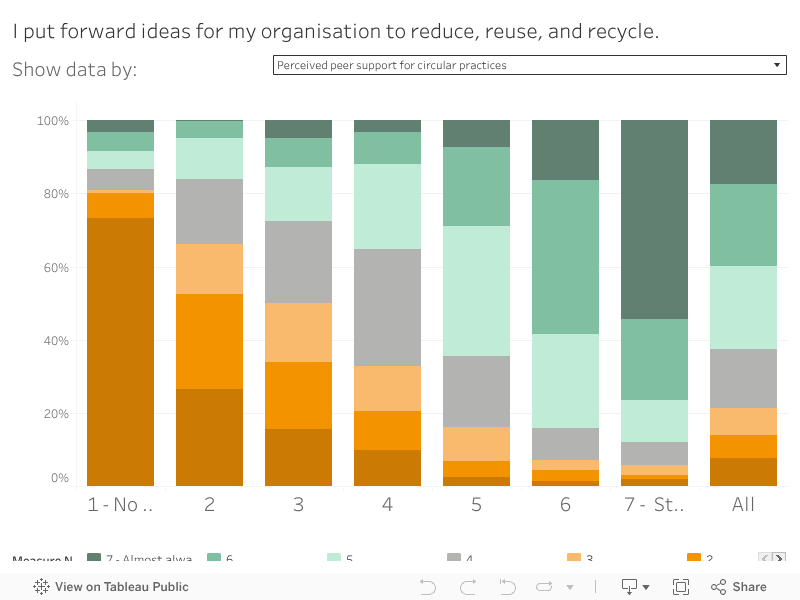
In addition, we observe that employees are more engaged in circularity when most people in their organization approve of efforts to reduce, reuse, and recycle in their work. This correlation holds even among employees with low sustainability expertise. Employees are also more likely to engage when they feel that such actions are compatible with their work performance—that is, when they respond positively to the statement “I can perform my work in environmentally friendly ways by reducing, reusing, and recycling.” This pattern is again observed among those with low sustainability expertise. Finally, the same correlations are visible when the organization as a whole displays an overall goal to use fewer materials, increase the use of recycled materials, and extend product lifetimes.
Therefore, to foster circular behaviours among employees, companies should focus on building a circular organizational culture that goes beyond individual job descriptions. Additionally, organizations can engage employees by asking how they could be better supported to carry out their work in more environmentally friendly ways.

Data sources and references
This survey was conducted as part of the CircEUlar project by Ludwig-Maximilians-Universität München University and the University of Groningen. For the consumer survey, the presented results represent the unweighted mean values reported by survey respondents. A total of 5,651 observations were collected using nationally representative quotas and weights assigned on the basis of age, gender, education, and region. For further details, please refer to:
- Grealis, E., Rau, H., Pacheco, I., van der Werff, E., & Steg, L. (2025). Circular Consumption Survey [Data set]. Zenodo. https://doi.org/10.5281/zenodo.15267507
- Grealis, E., & Rau, H. (2025). Preliminary results from the Circular Consumption Survey (CircEUlar Deliverable 4.4). Zenodo. https://doi.org/10.5281/zenodo.16636919
The employee survey consisted of 3,391 employees working in the mobility, building, and manufacturing, across five European countries (without representative quotas).
For further details, please refer to:
- Pacheco, I., Wagner, B., Wang, X., van der Werff, E., & Steg, L. (2025). Data set of employee beliefs, perceptions, and behaviours regarding circularity [Data set]. Zenodo. https://doi.org/10.5281/zenodo.16909830
- Pacheco, I. M., Willems, A. Z., Bootsma, S. B., Van der Werff, E., Steg, L. (2025). Consumers’ values, beliefs, and willingness to engage in circular behaviours - Comparing perceptions of consumers and employees (CircEUlar Deliverable 3.1, C1). Zenodo. https://doi.org/10.5281/zenodo.16910218
- Wagner, B. A., van der Werff, E., & Steg, L. (2025, August 21). Values for Circular Work: Biospheric Beliefs, Self-Efficacy, and Social Norms in Circular Workplace Pro-Environmental Behaviours and Activism. DOI 10.17605/OSF.IO/B6AJV Retrieved from osf.io/b6ajv
- Joltreau, E., Pacheco, I. (in progress) Beyond Good Intentions: Measuring Employee Understanding of Rebound Effects and Corporate Rebound Mitigation Actions